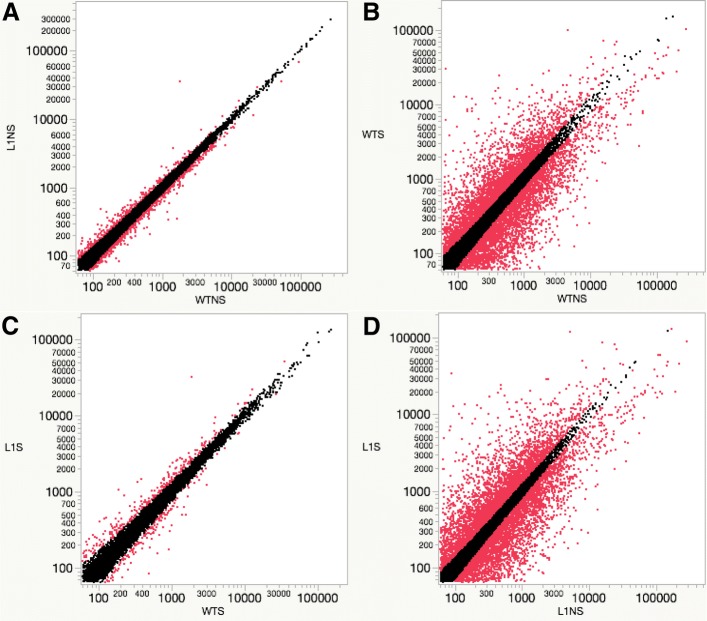
Fig. 1.
Scatter plot showing significantly differential gene expression (p < .05) comparing different rice lines and/or conditions. a Comparison of wild type under normal condition (WTNS) and 35S-OsCam1–1 under normal conditions (L1NS), b wild type under normal conditions (WTNS) and wild type under stress conditions (WTS). c wild type under stress conditions (WTS) and 35S-OsCam1–1 under stress conditions (L1S). d 35S-OsCam1–1 under normal conditions (L1NS) and 35S-OsCam1–1 under stress conditions (L1S). The X and Y axes represent the base mean for the RNA-seq data

