
Fig. 6.
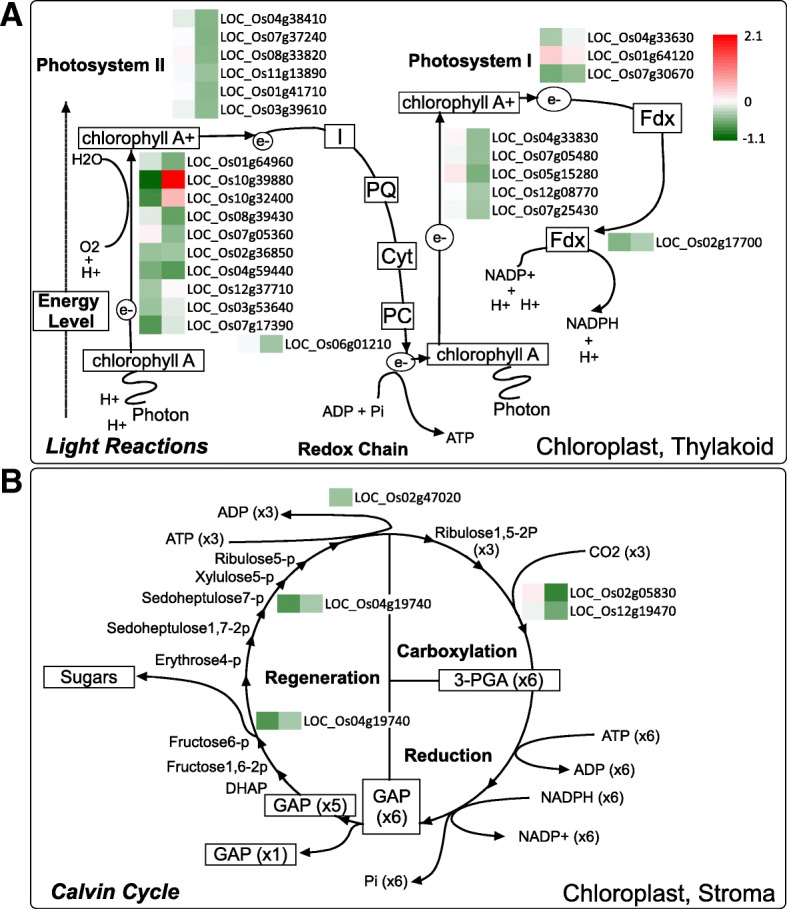
Photosynthetic pathway showing the expression level and role(s) of the genes in the light reaction (a) and Calvin cycle. b The left box shows the log2-fold change in comparisons of WT and transgenic plants under normal conditions, and the right box represents the log2-fold change under salt stress conditions