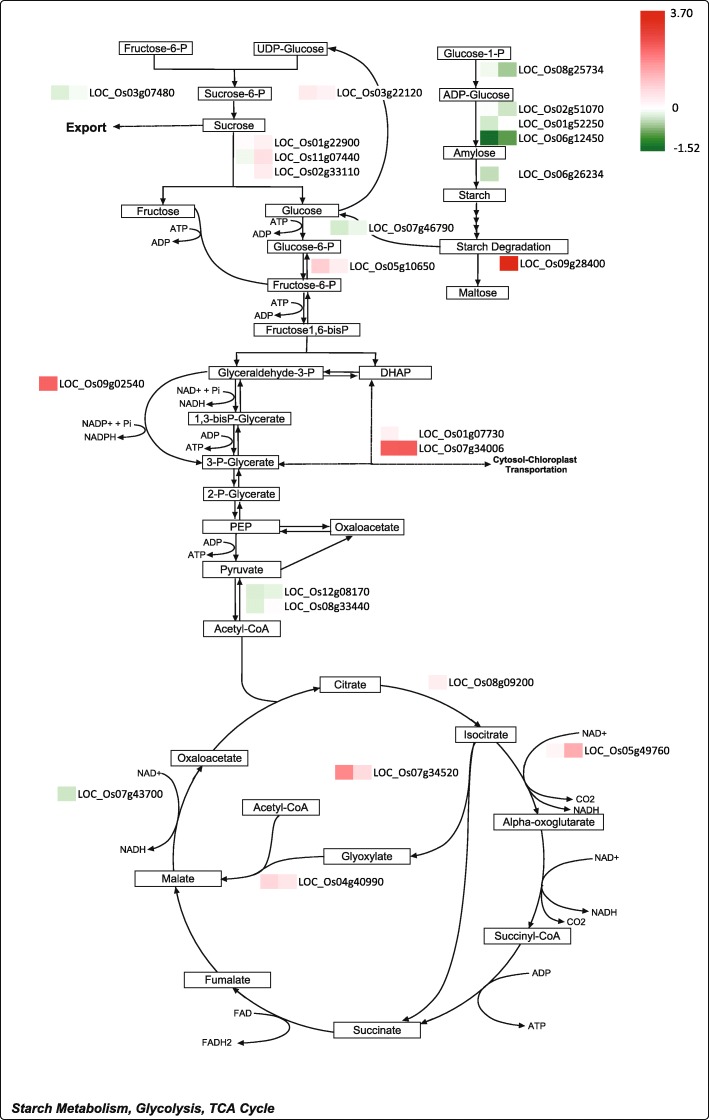
Fig. 7.
Carbohydrate and energy metabolism pathway consisting of sucrose-starch metabolism, glycolysis and the TCA cycle show the gene expression level and function in metabolism. The left box shows the log2-fold change of comparisons of WT and the transgenic plants under normal conditions, and the right box represents the log2-fold change under salt stress conditions

