Fig. 1.
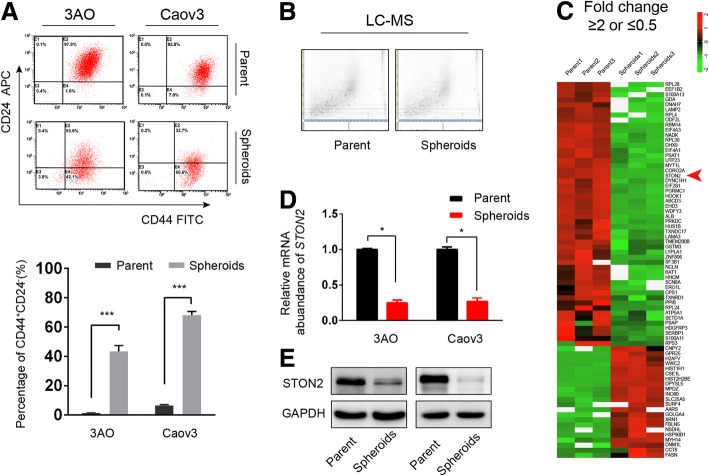
STON2 expression is down-regulated in an OCSC-enriched population. a 3AO and Caov3 cells were cultured in spheroid culture conditions to enrich OCSCs. The CD44+CD24− cell population were analyzed by FCM. The parental cells in normal culture were used as the control. b 2D feature maps of LC-MS/MS data from the analysis between parental cells and spheroids of 3AO cells. The horizontal axis shows retention time, the vertical axis shows mass-to-charge ratio, and the gray color level indicates the intensity value. c Protein cluster map generated by Cluster software (FDR < 0.05, fold change ≥2 or ≤ 0.5). Proteins up-regulated in spheroids are shown in red, and the down-regulated proteins in green. The intensity of the color green or red corresponds to the degree of alteration, according to the color strip at the right of the figure. The arrow indicates STON2. d qPCR analysis of STON2 expression in parental cells and spheroids. e Immunoblot analysis of STON2 expression in parental cells and spheroids. Data represents the mean ± S.E. of three independent experiments. The level of significance is indicated by *P < 0.05, ***P < 0.001

