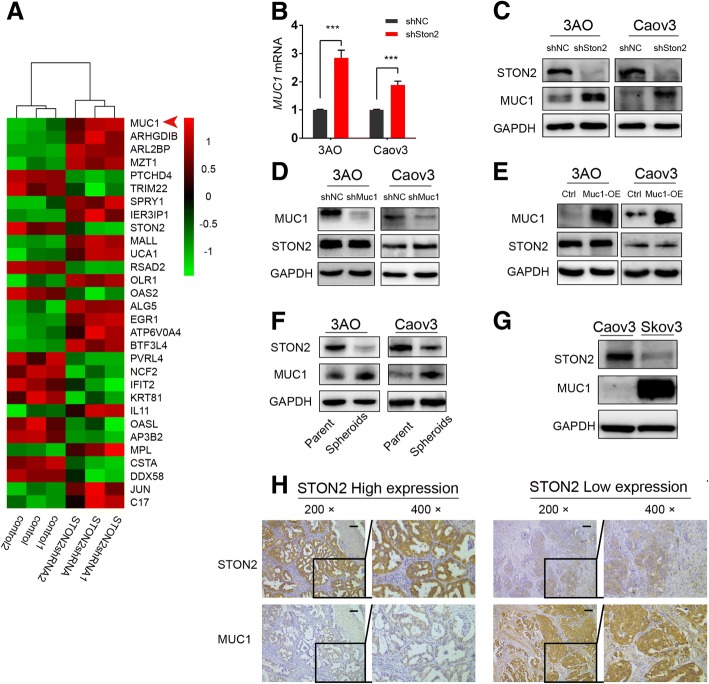
Fig. 4.
MUC1 acts as a downstream target for STON2. a RNA-seq data from the analysis between shNC and shSTON2 of 3AO cells derived stem cells. The cluster map generated by DESeq2 software analysis shows a series of differentially expressed genes (Padj < 0.05). Genes up-regulated in shSTON2 are shown in red, and down-regulated genes in green. The intensity of the color green or red corresponds to the degree of alteration, according to the color strip at the right of the figure. The arrow indicates MUC1. b qPCR analysis of MUC1 mRNA expression regulated by STON2 in 3AO and Caov3. c Immunoblot analysis of MUC1 protein level regulated by STON2 in 3AO and Caov3. d STON2 protein level after MUC1 knockdown in 3AO and Caov3. e STON2 protein level after MUC1 overexpression in 3AO and Caov3. f Immunoblot analysis of STON2 and MUC1 expression in parental cells and spheroids. g Immunoblot analysis of STON2 and MUC1 expression in Caov3 and Skov3 cells. h Specimen sections from the paraffin-embedded block from ovarian cancer patients were used for detection using anti-STON2 and anti-MUC1 antibodies, respectively. Paired STON2 and MUC1 staining is shown at 200× and 400× magnifications. Data represents the mean ± S.E. of three independent experiments. The level of significance is indicated by ***P < 0.001

