Fig. 6.
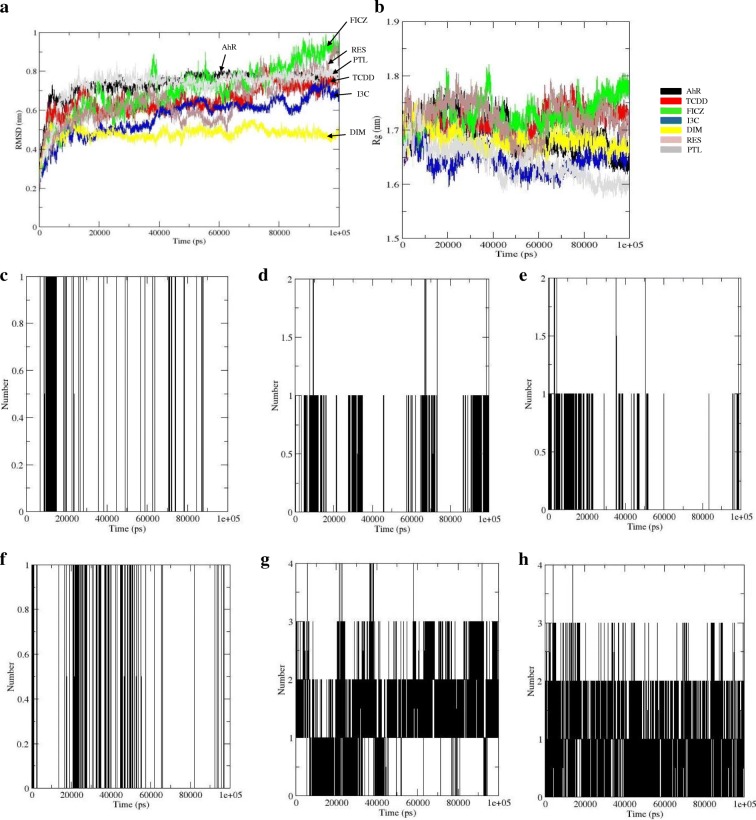
Conformational stability of the AhR LBD with each ligand during the 100 ns of MD simulations. a Represents the RMSD calculated for the AhR LBD and AhR LBD-ligand complexes. b Represents the Radius of gyration for the AhR LBD and AhR LBD ligand complexes. The average number of intermolecular Hydrogen bonds during 100 ns MDS for c AhRLBD-TCDD complex d AhRLBD-FICZ e AhRLBD-I3C f AhRLBD-DIM g AhRLBD-RES h AhRLBD-PTL. Black color lines represent the presence of H-bonds

