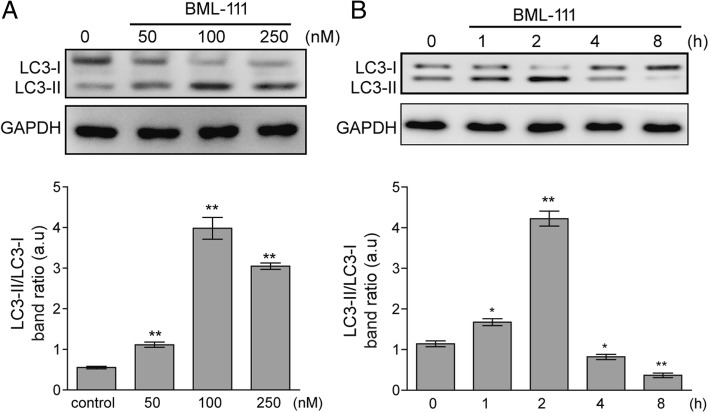
Fig. 2.
BML-111 elevated LC3-II level in AMs. AMs were treated with increasing concentrations of BML-111 for 2 h (a) or with 100 nM of BML-111 for indicated time periods (b). The expression of LC3-I and LC3-II was examined by Western blot. Representative Western blot image was shown on the top and the LC3-II/LC3-I ratio shown on the bottom. n = 3, *P < 0.05, **P < 0.01

