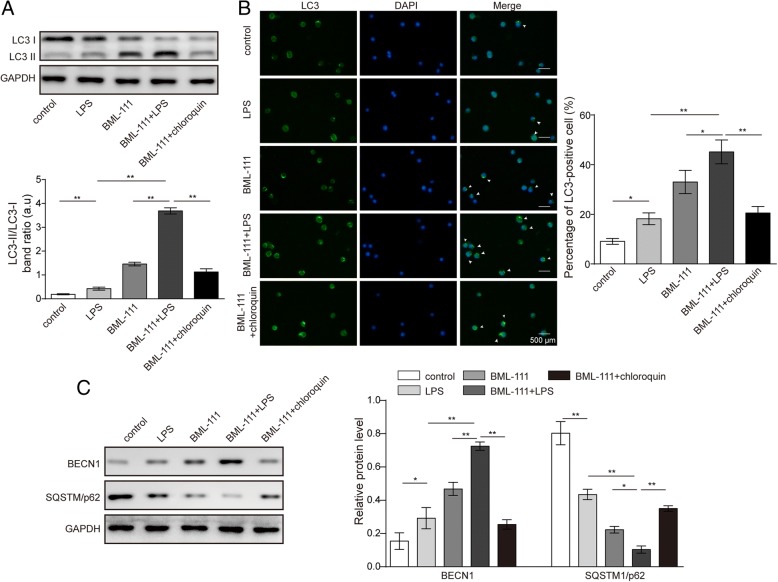
Fig. 3.
BML-111 elevated autophagy level in LPS-treated AM. AMs were treated as indicated. a The expression of LC3-I and LC3-II was examined by Western blot. Representative Western blot image was shown on the top and the LC3-II/LC3-I ratio shown on the bottom. b The expression of LC3-II in AM was detected by immunofluorescence (green signal). All cells were counter stained with DAPI (blue signal). Representative immunofluorescence images from indicated cells were shown on the left and the percentage of LC3-II+ cells quantified and shown as histogram on the right. c The expression of different autophagy and apoptosis biomarkers, including BECN1, SQSTM1/p62 was detected by Western blot. n = 3, *P < 0.05, **P < 0.01

