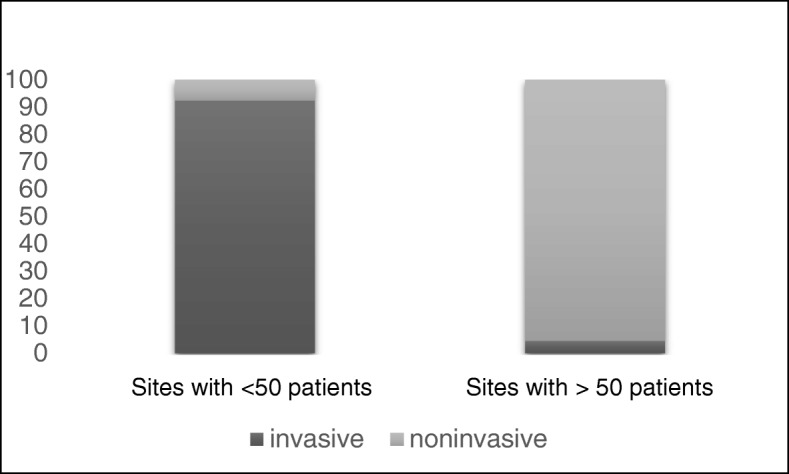
Fig. 1.

Distribution of mode of ventilation. Y axis shows percentage of patients. First column shows data from sites that care for less than 50 patients, the second column shows data from units that care for more than 50 patients. Dark shading shows patients ventilated invasively, lighter shading shows patients ventilated noninvasively.
