Fig. 3.
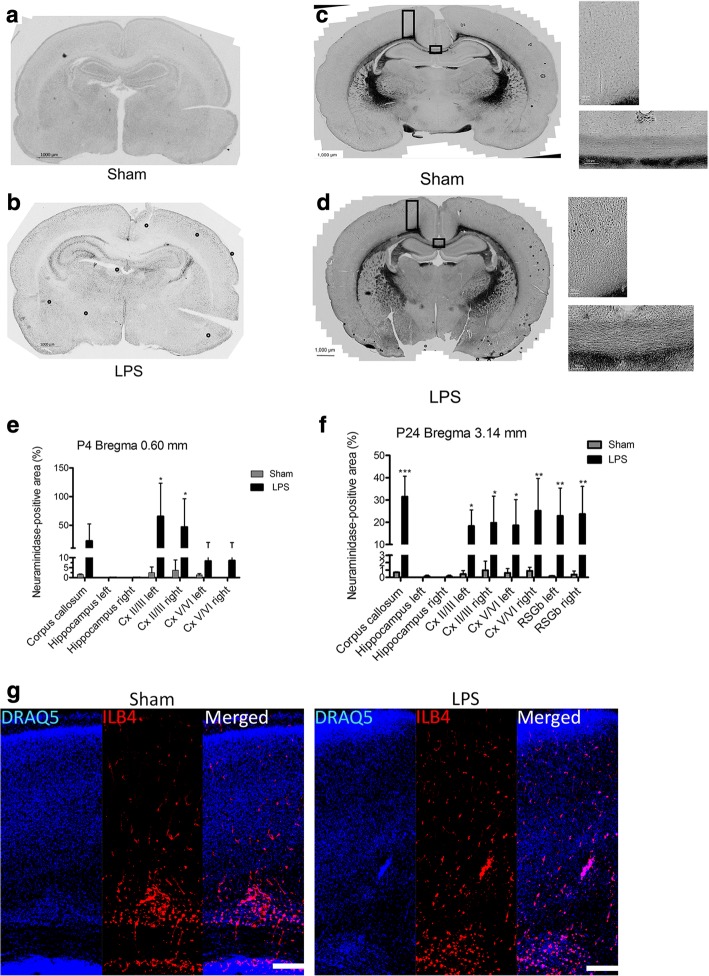
Pan-neuraminidase activity against the X-Neu5Ac substrate is increased in the cortex of LPS-injected rats and shows a pattern different from that of activated microglial cells. Panels (a) and (b) show representative coronal brain slices of Sham (n = 3) and LPS-injected (n = 3) rat pups 1 day (P4) after injection and panels (c) and (d), 21 days (P24) after injection. The bar graphs (e) and (f) show a relative size of X-Neu5Ac-stained areas (% of total areas) measured in seven different regions for P4 brains: corpus callosum, hippocampus (left and right), and the upper (layers II–III) and lower (layers V–VI) somatosensory cortices (left and right), and in nine different regions for P24 brains: corpus callosum, hippocampus (left and right), the upper (layers II–III) and lower (layers V–VI) somatosensory cortices (left and right), and RSGb (left and right). g Cortical distribution of activated microglia marked with ILB4 at P4 (scale bar = 200 μm) *p < 0.05, *** p < 0.001

