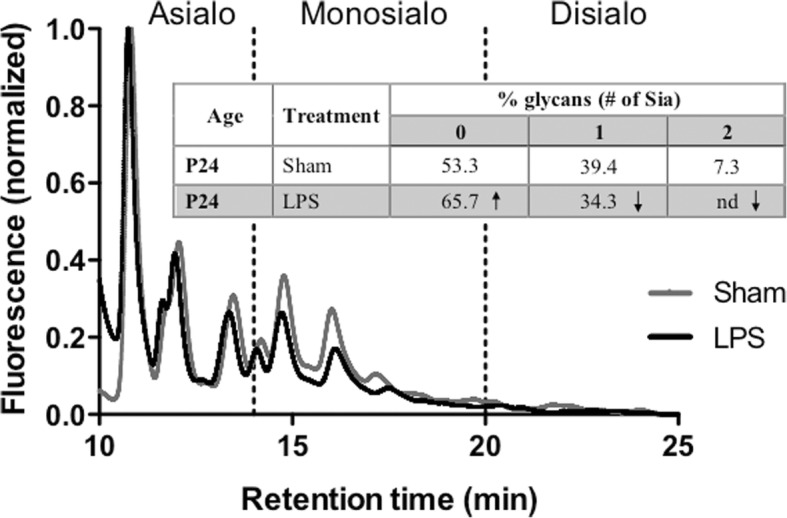
Fig. 6.

Profile of N-glycans from brain tissues of LPS-exposed and saline-treated (Sham) animals 21 days after injection. Fluorescence chromatograms of N-glycans cleaved from proteins in homogenates of brains from Sham and LPS-injected rat pups were analyzed by LC-MS after fluorescent labeling. Samples were fractionated on an anion exchange column, where glycans with higher content of sialic acid elute at later retention times. Shaded regions indicate the retention times of glycans containing 0 (< 14.5 min), 1 (14.5–20 min), and 2 (> 20 min) sialic acid residues. The traces show fluorescence intensity (arbitrary units). Individual peaks were assigned to specific glycan structures using the MS data and quantified by integrating the areas under the chromatograms (table in the inset). Figure shows representative profiles of duplicate experiments
