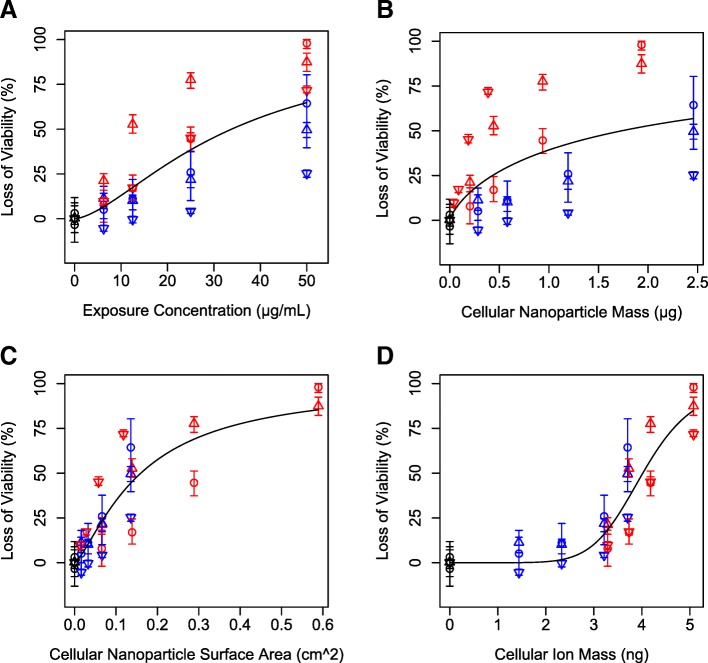
Fig. 2.
Loss of viability in RAW 264.7 cells (circle) and bone marrow derived macrophages from wild-type mice (up triangle) and SR-A deficient mice (down triangle) exposed to various concentrations of 20 nm (red) or 110 nm (blue) silver nanoparticles (a) as a function of various dose metrics predicted by ISD3 including cellular nanoparticle mass (b), cellular nanoparticle surface area (c), and cellular ion mass (d). Lines are dose response model fits to the data

