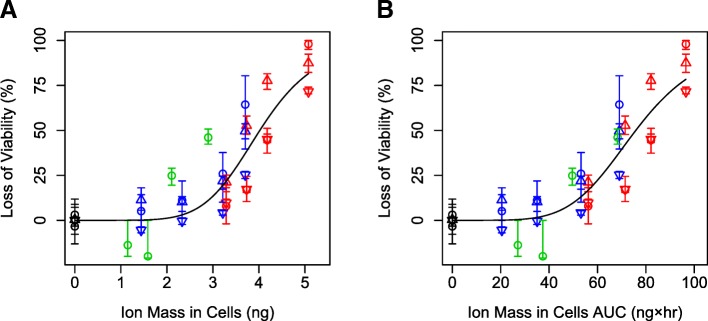
Fig. 4.
Loss of viability in RAW 264.7 cells (circle) and bone marrow derived macrophages from wild-type mice (up triangle) and SR-A deficient mice (down triangle) exposed to various concentrations of 20 nm (red), 110 nm (blue) silver nanoparticles, or silver ions formed from dissolution of 20 nm silver nanoparticles (green) as a function of ion mass in cells (a) or ion mass in cells AUC (b) predicted by ISD3. Lines are dose response model fits to the data

