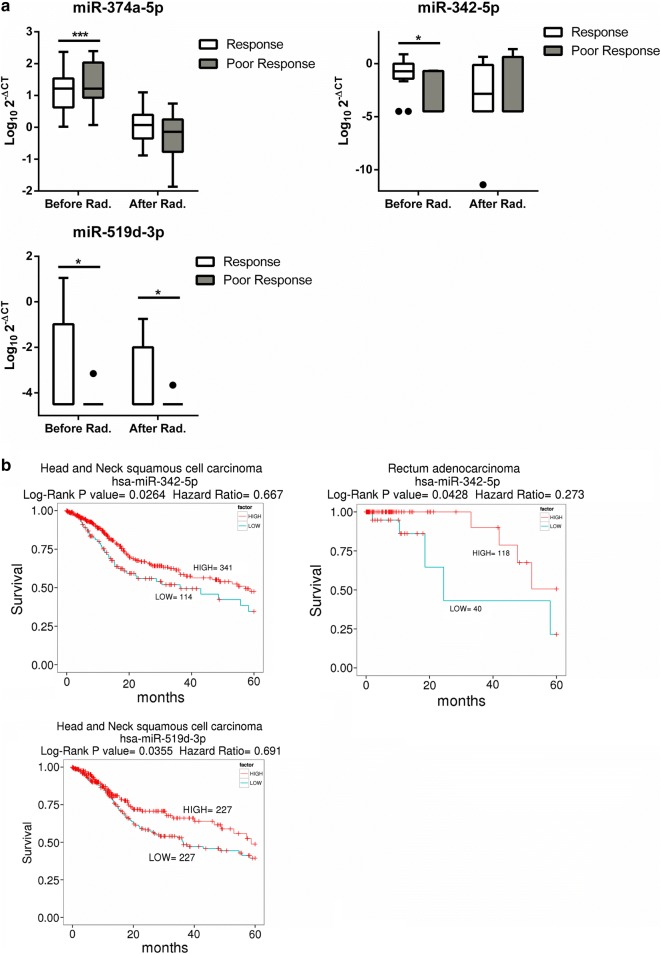
Fig. 2.
The difference in the miRNA expression levels between the poor responsive and responsive groups. a Difference in the miRNA expression in the poor responsive vs responsive groups before or after radiation. miRNA levels from the plasma of patients detected by qRT-PCR using RNU6 as a control. b The Kaplan–Meier survival curve of head and neck patients: low miRNA expression versus high miRNA expression. The statistical significance of the difference between the two groups was showed. The Y axis presents the expression level (Log10 2−ΔCT). Rad radiation. Student’s t-test: *P value < 0.05; **P value < 0.01; ***P value < 0.001

