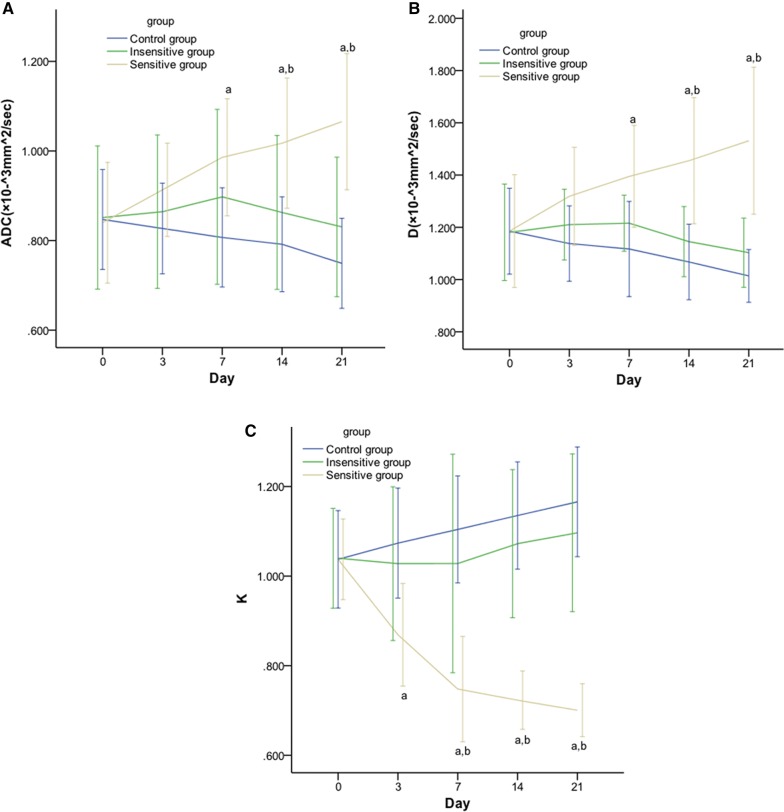
Fig. 3.
Line graphs showing the effect of DTX on DWI and DKI parameters in rat EOCs. From day 7 after DTX administration, ADC (A) and D (B) values of the sensitive group were significantly decreased compared with those of the insensitive and control counterparts from day 14. K (C) value of the sensitive group is significantly decreased compared to its insensitive counterpart from day 3 and to control group from day 14. p < 0.05, a: sensitive vs. control; b: sensitive vs. insensitive

