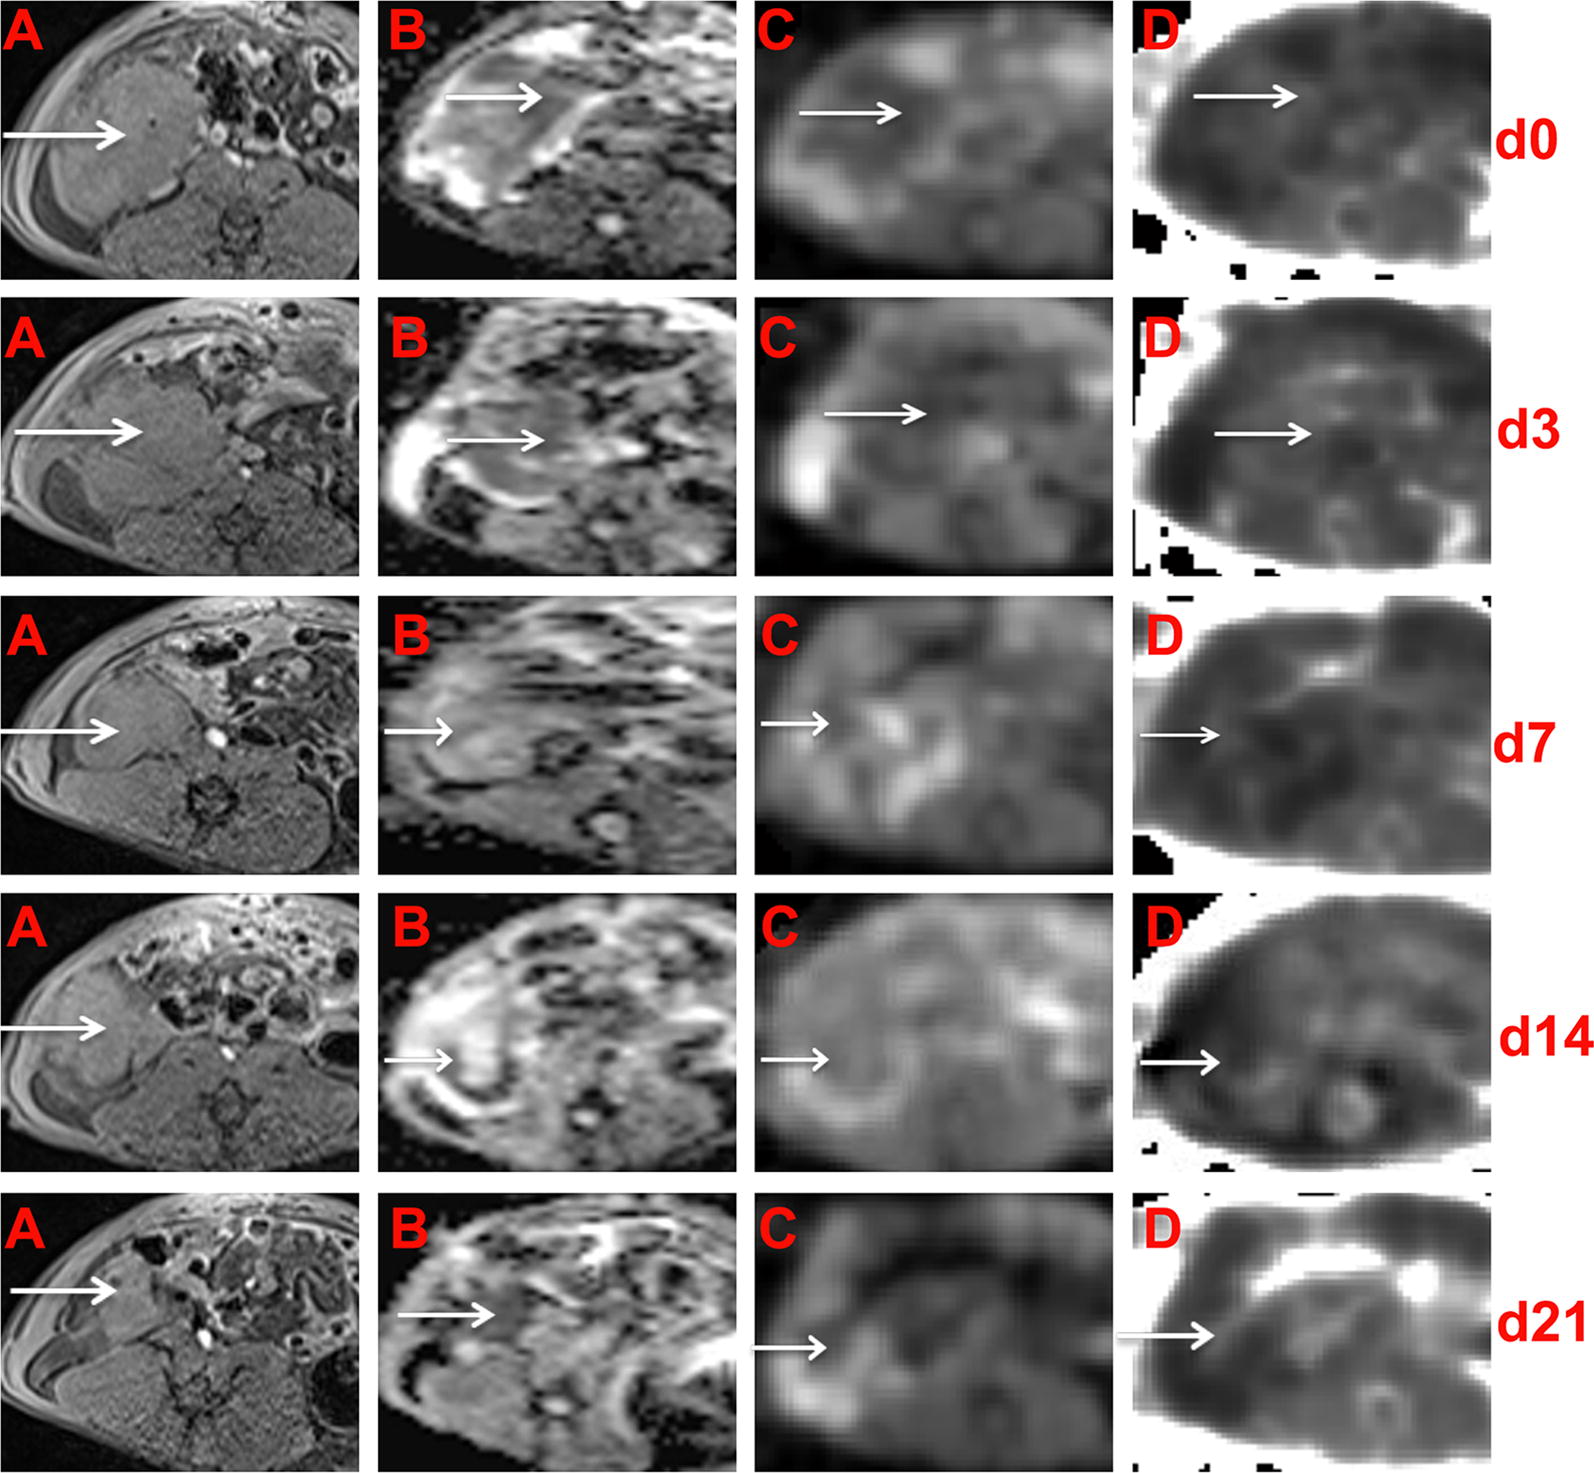
Fig. 4.

Conventional, DWI and DKI of EOCs in sensitive rats at different time points. In the right adnexal area, a multilocular cystic-solid EOC (arrow) progressively decreased on T1WI (A). ADC maps were generated from standard DWI (B) and D maps (C) and K (D) maps were generated from DKI. The solid component) showed hypointensity on the ADC maps, hyperintensity on the K maps and hypointensity on the D maps
