Fig. 2.

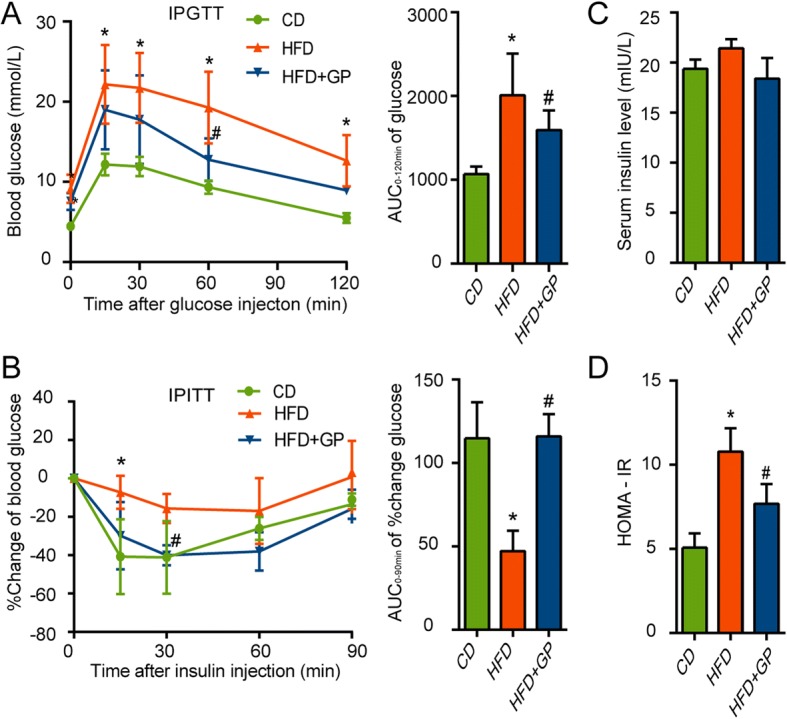
The effect of GP on glucose tolerance and insulin sensitivity. At the end of 15 weeks, IPGTT and IPITT were measured. a Effect of GP on the glucose tolerance was determined by intraperitoneal glucose tolerance test (IPGTT) and quantification of the area under the curve (AUC) from the IPGTT (n = 4 per group). Effect of GP on the insulin resistance was determined by intraperitoneal insulin tolerance test (IPITT). b Percent change of blood glucose during the IPITT was calculated as [(value of certain blood glucose - primary value)/primary value] (n = 4–5 per group) and quantification of the area under the curve (AUC) from the % change of glucose. c Fasting serum insulin was measured at the end of experiment. d Homeostasis model assessment-insulin resistance (HOMA-IR) was calculated as [fasting serum glucose (mmol/L) × fasting serum insulin (mIU/L)/22.5] (n = 4–5 per group). Error bars represent the standards deviation Statistical was done by one-way ANOVA, *P<0.05 versus CD,#P<0.05 versus HFD
