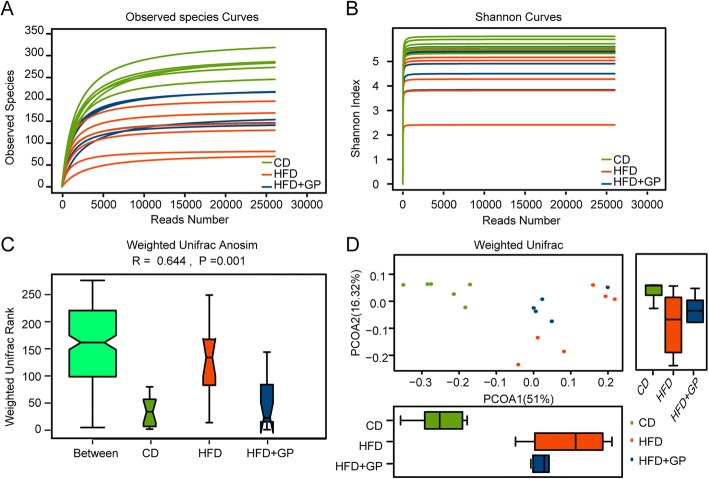
Fig. 4.
The effect of GP on diversity and abundance of gut microbiota. a Observed species analysis. Curves were generated by setting the reads number as X axis, and number of observed OTUs as Y axis. b Shannon index analysis. Curves were generated by setting the reads number as X axis, and the Shannon index value as Y axis. Shannon index value indicated the diversity of the samples. c Weighted unifrac anosim analysis. Higher weight unifrac rank in between group indicated that the discrepancy among groups was greater than that within the group. R value is between − 1 and 1, R > 0 indicates that meaningful differences exist between groups, R < 0 indicates that the differences within the group is greater than that between groups. P < 0.05 indicates statistical significance. d Weighted unifrac PCoA analysis. PCoA1 and PCoA2 in X and Y axis represented two principle discrepancy components between groups, and the percentage in bracket means contribution value to the discrepancies by the component. Dots represent samples. Samples in same group share same color. (n = 6 per group)

