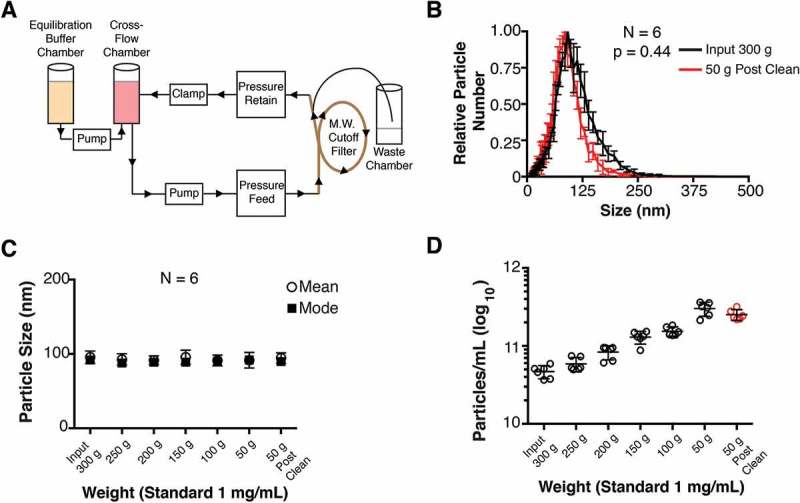
Figure 1.

Diagram of cross-flow filtration.
(a) A cross-flow chamber containing the input fluid (tissue culture supernatant, human plasma, tumour fluid, etc.) is pumped into a molecular weight cut-off filter. Molecules smaller than the size exclusion of the MW filter are sent to a waste chamber, whereas molecules larger than the size exclusion MW filter (in this case, EV) are returned to the cross-flow chamber. As the volume in the cross-flow chamber decreases, equilibration buffer is pumped in from the equilibration chamber. After equilibration buffer has been depleted, a final clarified product of concentrated EV can be used. (b) Particle size distribution (from cultured BCBL-1 cells) for Input 300 g and 50 g “Post-Clean” samples, with the modes arbitrarily standardized to 1 (N = 6). (c) Particle sizes were determined by NTA at progressive time points during the CFF concentration step. (d) Concentration of particles measured in each fraction during the CFF concentration step (N = 6).
