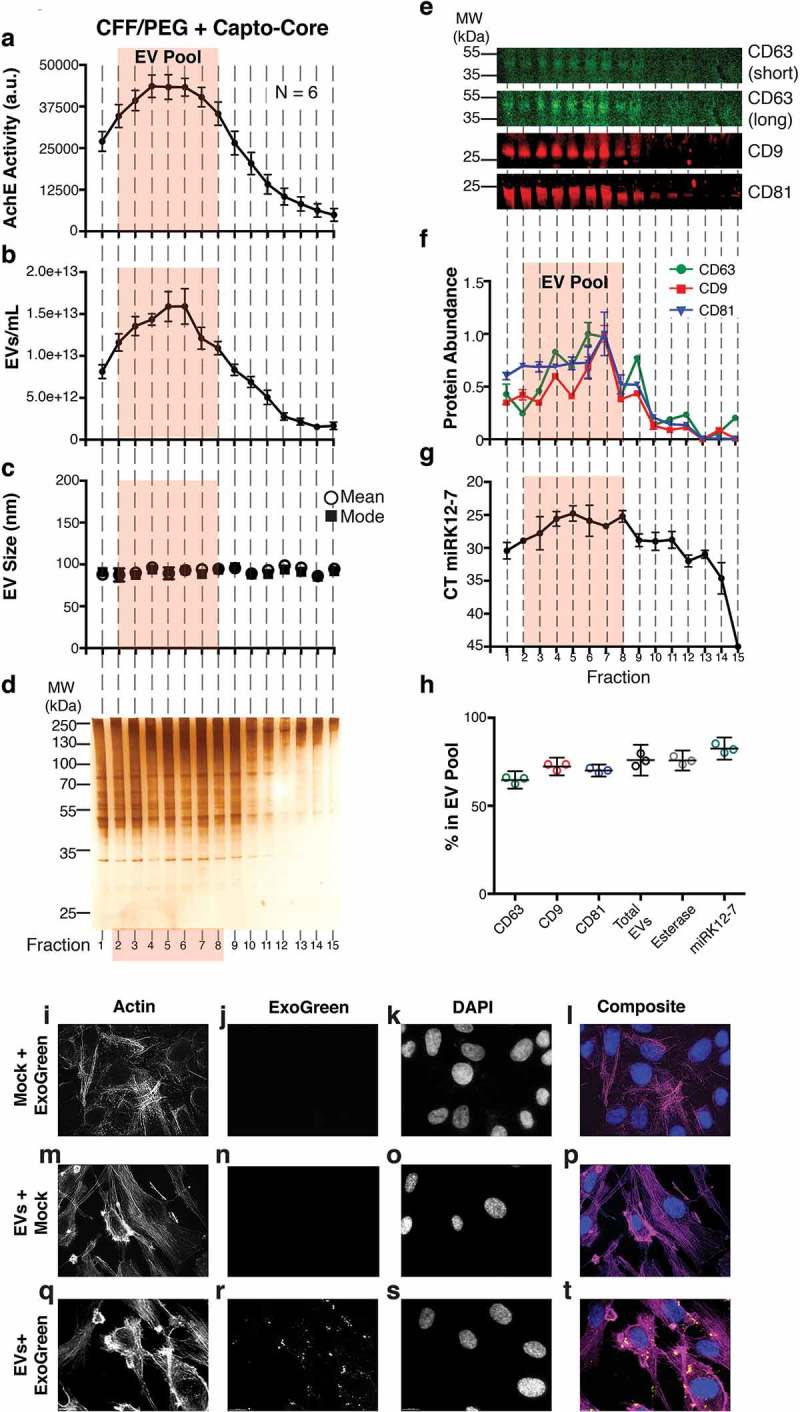
Figure 3.

Characterization of a high-confidence “EV Pool” from Capto Core fractionates of the CFF/PEG EV.
(a) The EV pellet isolated via cross-flow filtration was added to high molecular weight cut-off Capto Core resin and fractions were collected and assayed for esterase activity (N = 6). An orange box highlighting fractions 2–8 of the Capto Core fractionates was added to indicate an “EV Pool” (b) Total particles/mL for each fraction, as measured by NTA (N = 6), with the “EV Pool” fractionates highlighted. (c) Mean and mode sizes of the particles in the fractions, as measured by NTA (N = 6), with the “EV Pool” fractionates highlighted. (d) Silver stain analysis of each fraction (gel is representative of 6 independent runs). (e) Quantitative immunoblot of the tetraspanin proteins CD63, CD9, and CD81 in the Capto Core fractions. (f) Band intensities from (e) were quantified in Image Studio. The highest band density was arbitrarily standardized to 1, with the “EV Pool” fractionates highlighted. (g) The KSHV-encoded microRNA miRK12-7 was quantified by RTq-PCR in each fraction, with the “EV Pool” fractionates highlighted. (h) Percent in the EV Pool for each assay was calculated. (i-l) hTERT-HUVECs were incubated with ExoGreen label + Mock (no EV and post filtration) for 12 h and single plane images were deconvoluted. The cells were stained for Actin (Rhodamine Phalloidin) (i), the ExoGreen marker (j), and nuclei (DAPI) (k). A composite image is shown in (l). (m-p) hTERT-HUVECs were incubated with unlabelled EV (post filtration) for 12 h and single plane images were deconvoluted. The cells were stained for Actin (Rhodamine Phalloidin) (m), the ExoGreen marker (n), and nuclei (DAPI) (o). A composite image is shown in (p). (q-t) hTERT-HUVECs were incubated with labelled CFF/PEG EV (post filtration) for 12 h and single plane images were deconvoluted (q-t). The cells were stained for Actin (Rhodamine Phalloidin) (q), the ExoGreen marker (r), and nuclei (DAPI) (s). A composite image is shown in (t).
