Figure 4.

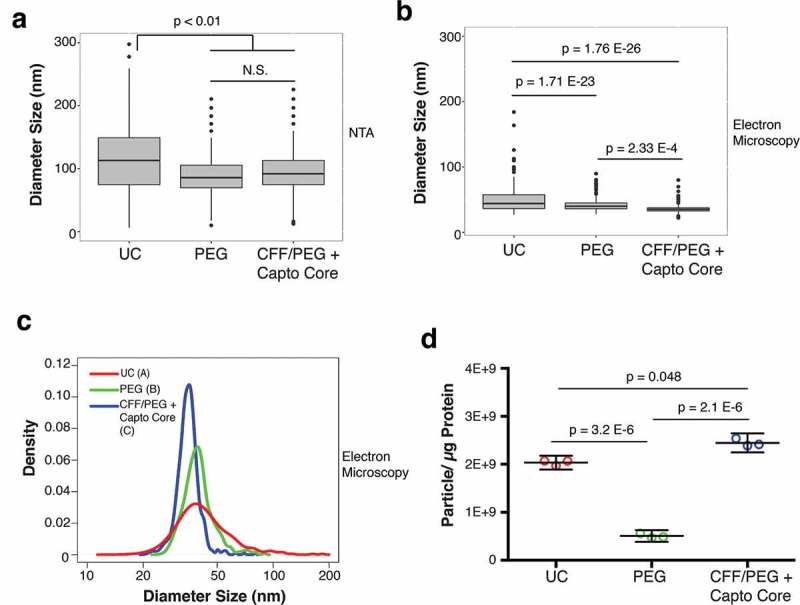
Final size comparison between EV isolated by the three methods.
(a) Plot of the NTA analysis of the diameter of final EV products isolated by UC, PEG, or by CFF/PEG + Capto Core filtration (ANOVA and T-tests, N = 6). (b) Plot of the TEM analysis of the diameter of final EV products isolated by UC, PEG, or by CFF/PEG + Capto Core filtration (Wilcoxon Rank Sum Test, N = 3). (c) Density and diameter plot of the EV visualized by TEM. The area under each curve was arbitrarily set to 1. Wilcox rank sum test was used to determine statistical significance between the three groups and are labelled by a letter next to the figure legend. All graphs and statistics were done in R (Wilcox Rank Sum Test/Integration-based T-test, N = 3). (d) EV purity analysis from three methods. A particle to protein calculation was conducted on the final products obtained from the three methods, as measured by NTA and BCA assay, respectively (ANOVA and T-tests, N = 3).
