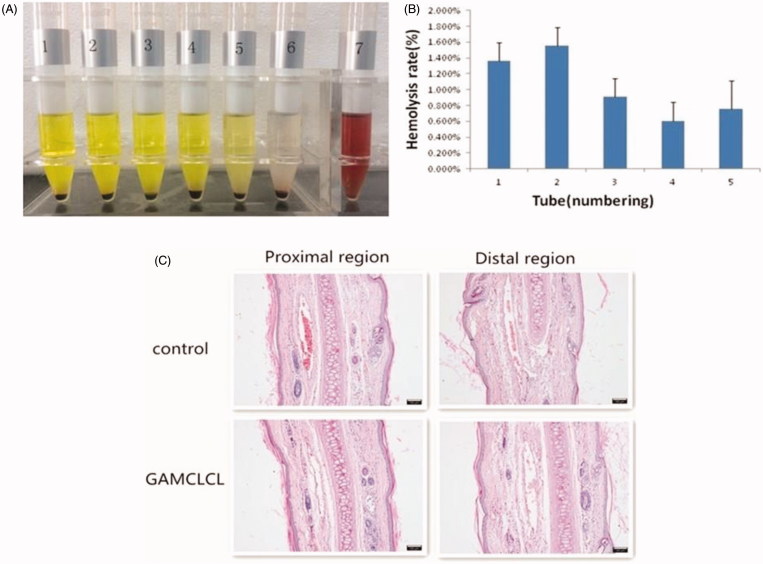
Figure 2.
The safety results of GAMCLCL. A: Photograph of sample hemolysis test. Tube 1-5 are sample tube, their concentrations from high to low; tube 6 is negative tube; tube 7 is positive tube. B: the bar graph for hemolysis rate of GAMCLCL from tube 1 to 5. C: photograph of rabbit ear-rim vein slice of HE staining (100X). (The scale bar = 100 um).

