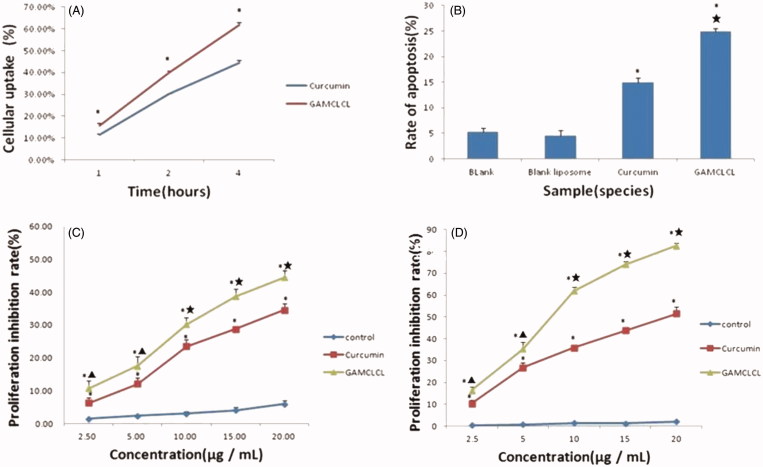
Figure 3.
The results of cellular test in vitro. A: the line chart of cellular uptake by flow cytometry in 1, 2, 4 hours, respectively. Compared to free curcumin, *p < .01. B: the bar graph of cellular apoptosis rate by flow cytometry. Compared to two blank groups, *p < .01; compared to curcumin group, ★p < .01. C: the line chart of cytotoxicity at different concentrations within 24 hours. D: the line chart of cytotoxicity at different concentrations in 48 hours.

