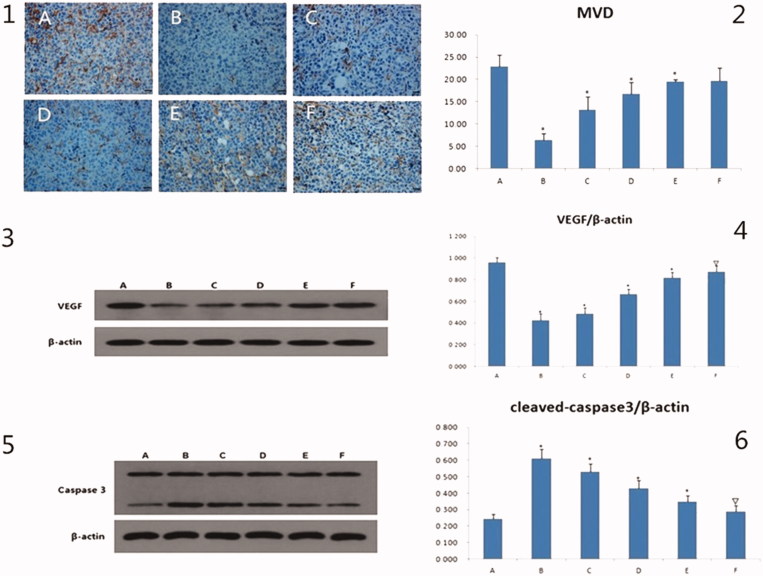
Figure 5.
The results of MVD, VEGF, caspase3 in vivo. 1: the immunohistochemical pictures of MVD, the scale bar = 20 μm. 2: the bar graph of MVD of different groups, compared to mode group, *p < .01. 3 and 5 are the electrophoresis picture of VEGF and caspase3, respectively. 4 and 6 are bar graph of VEGF and caspase3, respectively. The β-actin is as internal standard, compared to mode group, △p < .05, *p < .01. A: mode group; B: adriamycin group; C: high dose of GAMCLCL group; D: middle dose of GAMCLCL group; E: Low dose of GAMCLCL group; F: curcumin group.

