
Figure 4.
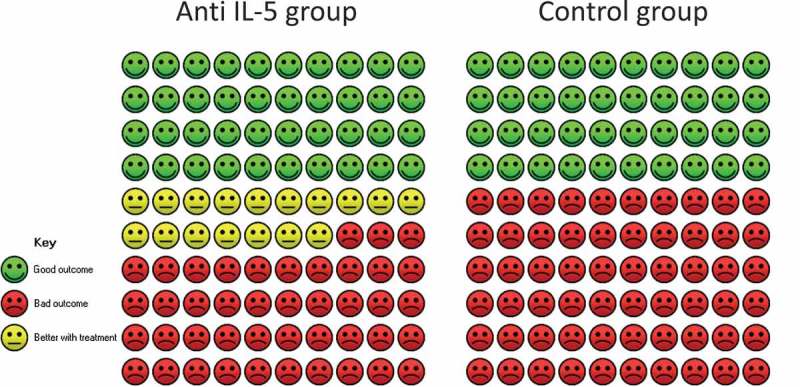
Cates plot illustrating percentage of patients who experience 0 exacerbations. The Cates plot is based on the absolute effect calculated by the median for the control non-event rate in the included studies (40.2%). This gives a difference of 16.9%-points in the percentage of patients who experience 0 exacerbations.