
Figure 5.
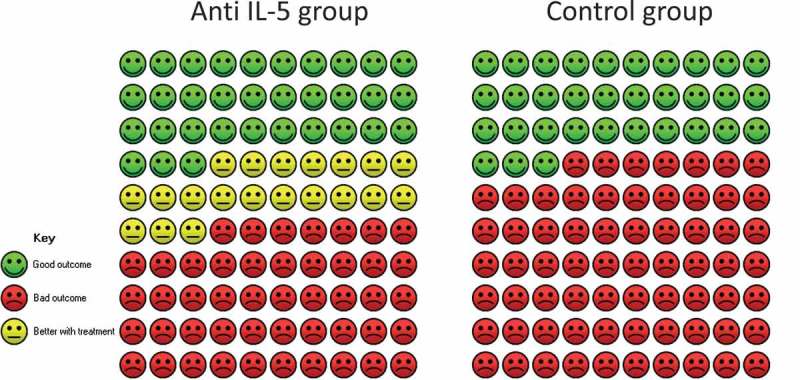
Cates plot of patients who experienced ≥50% reduction in oral corticosteroid treatment. The Cates plot is based on the absolute effect calculated by the median for the control non-event rate in the included studies (33%). This gives a difference of 20.3%-points in the percentage of patients who experience ≥50% reduction in oral corticosteroid treatment.