
Figure 4.
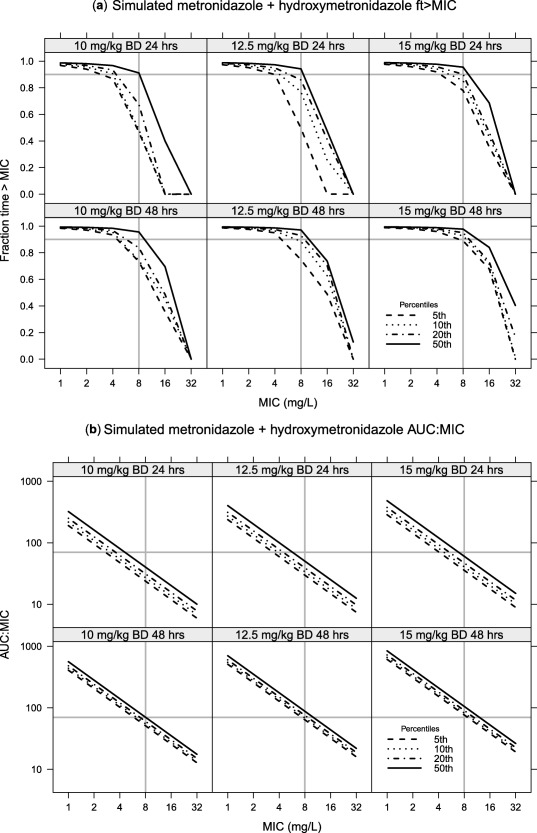
Simulations for free metronidazole plus hydroxymetronidazole under 10, 12.5, and 15 mg/kg twice daily dosing, with hydroxymetronidazole concentrations being multiplied by 0.65 to reflect the assumed lower activity. A break‐point of 8 mg/L is highlighted. (a) Yhe ft > MIC with a value of 0.9 highlighted; whereas (b) shows the AUC:MIC ratio with a cutoff of 70 mg.h/L highlighted. A comparison of 24‐ and 48‐hour target attainment is given in the upper and lower panels, respectively.