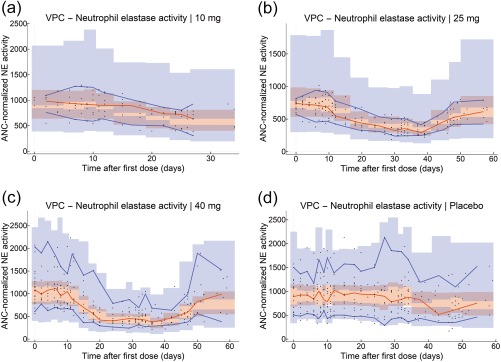
Figure 4.

Visual predictive checks (VPCs) of the final NE activity model. VPCs were stratified on dose group (a = 10 mg, b = 25 mg, c = 40 mg, d = pooled placebo). Black dots show the individual observations of ANC‐normalized NE activity (see Supplementary Methods). Blue lines show the 5th and 95th percentiles of the observed data, and red lines show the median of the observed data. The blue and red shaded areas show the 95% CIs of the model‐predicted 5th, median, and 95th percentiles based on simulated data from 1,000 simulations.
