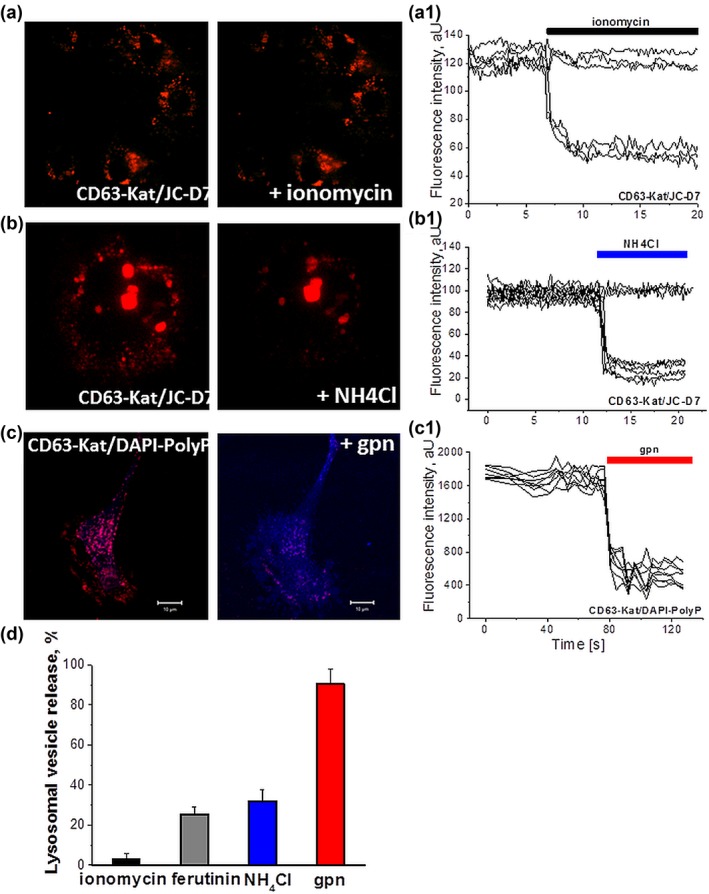
Figure 5.

Total internal reflection microscopy (TIRF) imaging of lysosomal vesicle polyP release. Representative images (a) and traces (measurement of polyP in individual vesicles) (A1) depicting partial release of polyP from lysosomes upon application of calcium ionophore ionomycin (1 μM). Partial lysosomal polyP release upon acidification of the cytosol with NH4Cl (b,b1). (c,c1) Application of glycyl‐l‐phenylalanine‐β‐naphthylamide (GPN, 100 μM) results in the collapse of lysosomes and release of polyP to the cytoplasm (see increase of DAPI‐polyP fluorescence (blue) in cytosol). (d) Summary data showing release of polyP from the lysosomes upon different stimuli [Color figure can be viewed at http://wileyonlinelibrary.com]
