Figure 2.

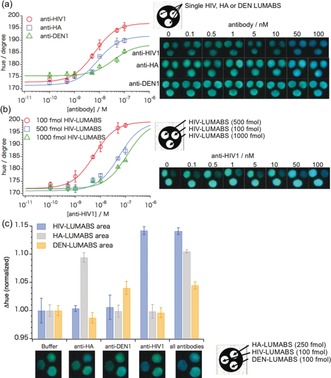
Typical colorimetric response curves and photographs of bioluminescence emission signals obtained with multi‐layer 3D‐μPADs after application of 20 μL aqueous antibody samples for devices with signal detection areas modified with a) identical amounts of multiple LUMABS (100 fmol for anti‐HIV‐LUMABS and anti‐DEN‐LUMABS, 250 fmol for anti‐HA‐LUMABS) targeting different antibodies (anti‐HIV1, anti‐HA, anti‐DEN1) and b) three different amounts of anti‐HIV‐LUMABS. c) Colorimetric response (normalized Δhue) of 3D‐μPADs responsive to multiple antibodies upon exposure to 33 nm of single antibodies or mixtures; error bars indicate the SD for triplicate experiments using readouts from three different signal detection areas on one single device (a) or three separate devices per data point (b,c). Data recorded 15 min after sample application.
