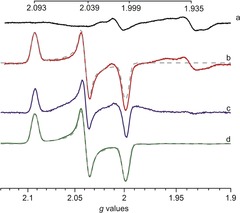
Figure 2.

Comparison of X‐band EPR spectra recorded on whole cells samples containing apo‐HydA1 or [2Fe]pdt‐HydA1 and purified [2Fe]pdt‐HydA1. Spectrum of cells containing a) the overproduced apo‐HydA1 enzyme and b) overproduced apo‐HydA1 enzyme treated with [2Fe]pdt under in vivo conditions, revealing an Hox‐like signal. c) Spectrum (a) subtracted from spectrum (b). d) Spectrum of purified [2Fe]pdt‐HydA1 (100 μm), treated with thionine to generate [4Fe‐4S]2+‐[FeIFeII]pdt (the signal was divided by a factor of 9.5 for clarity); simulations (with gzyx=2.093, 2.039, 1.999) are overlaid onto spectra (b) and (d) (grey dashes, see Table S1 for simulation parameters). Spectra were recorded at 10 K, microwave power=1 mW, frequency=9.28 GHz, modulation amplitude=1.5 mT, modulation frequency=100 kHz.
