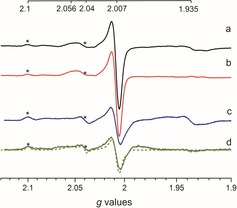
Figure 4.

X‐band EPR spectra of whole cell samples containing [2Fe]adt‐HydA1 recorded at different temperatures. a) Spectrum obtained at 20 K and b) apo‐HydA1 spectrum subtracted from spectrum (a). c) Spectrum obtained at 10 K and d) apo‐HydA1 spectrum subtracted from spectrum (c). A simulation combining Hox (40 %) and Hox‐CO (60 %) is overlaid onto spectrum (d) (grey dashes, see Table S1 for simulation parameters). Spectra were recorded at microwave power=1 mW, frequency=9.28 GHz, modulation amplitude=1 mT, modulation frequency=100 kHz. Signals attributable to the Hox state of the H‐cluster are labeled with asterisks.
