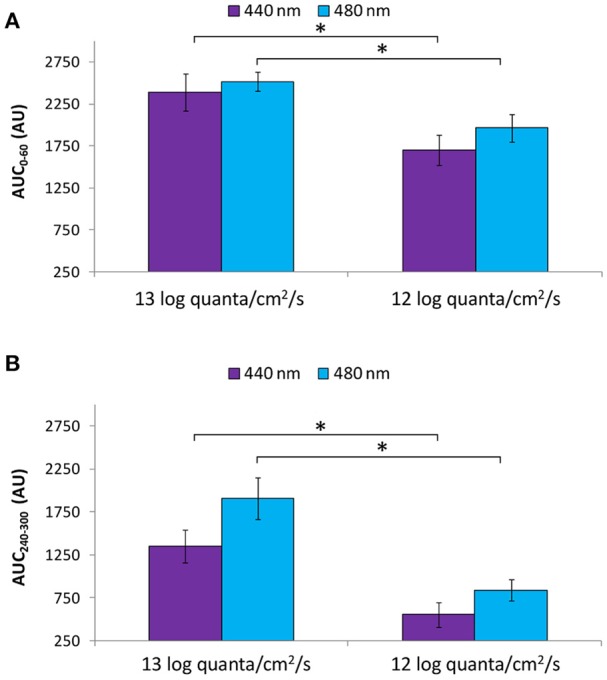
Figure 10.

Area under the curve (AUC, expressed in A.U.) over two time windows: from 0 to 60 s of light exposure (0–60 s; first minute of light exposure) (A) and from 240 to 300 s of light exposure (240–300 s; last minute of light exposure) (B) at higher (~13 log quanta/cm2/s) and lower (~12 log quanta/cm2/s) intensity purple (440 nm) and blue (480 nm) light. Error bars indicate SEM. *statistically significant differences (Mann Whitney U-test, p < 0.016).
