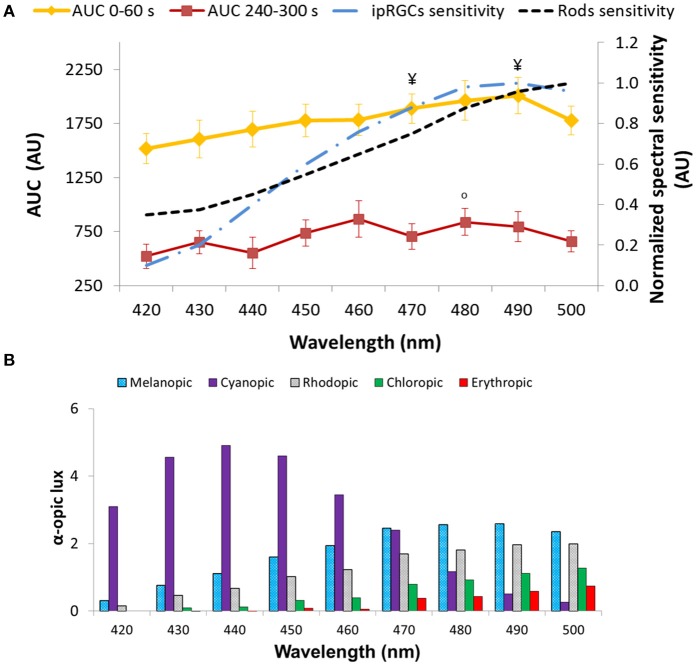
Figure 8.
Area under the curve (AUC, expressed in A.U.) over two time windows: from 0 to 60 s of light exposure (0–60 s; first minute of light exposure, in yellow) and from 240 to 300 s of light exposure (240–300 s; last minute of light exposure, in red). Paired-sample t-tests revealed significant differences between AUC0−60 and AUC240−300 for all the wavelengths tested (p < 0.05). Two-way repeated measures ANOVA showed an overall significant difference between 0–60 and 240–300 s (p < 0.001), wavelength (p < 0.001), and a significant interaction between both factors for all light conditions. ¥ indicates statistically significant differences (Wilcoxon post-hoc, p ≤ 0.001) in AUC0−60 vs. 430 nm. °indicates a statistically significant differences (Wilcoxon post-hoc, p < 0.005) in AUC240−300 vs. 420 nm. Plots of the ipRGC and rod normalized sensitivities are superimposed (A). Activation of the different photoreceptors according to each light tested, determined by the α-opic lux parameter calculated by the Irradiance toolbox (47) (B).

