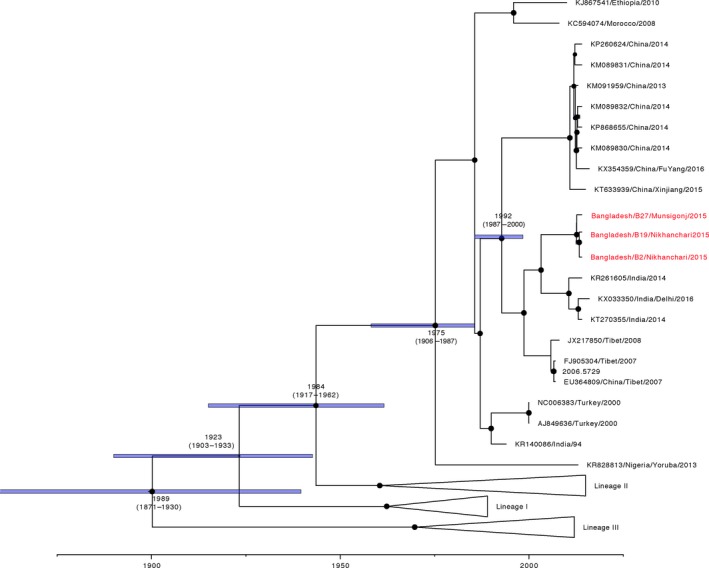
Figure 2.

Maximum clade credibility (MCC) tree from Bayesian analysis of full‐length PPRV genomes. The posterior probabilities are indicated by the size of the node, and TMRCA and 95% HPD of the branches are depicted. Accession number, country of origin and sampling year of each isolate is shown. All full‐length sequences generated in this study are highlighted in red and have been submitted to NCBI and awaiting accession numbers
