
Figure 1.
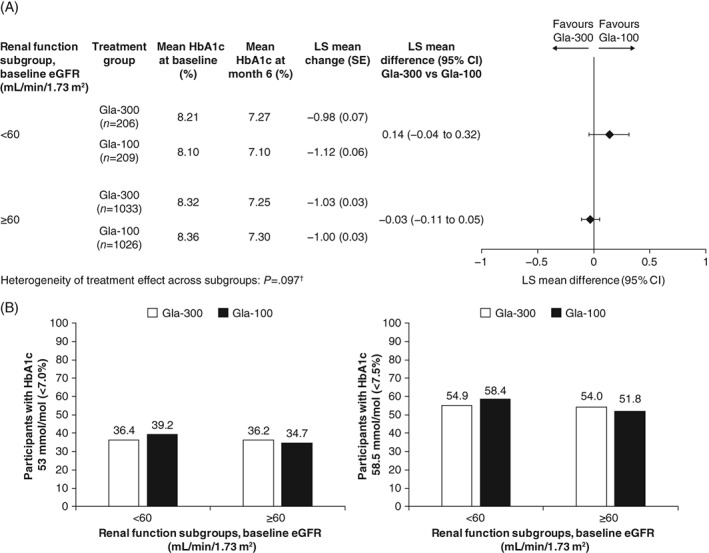
A, Mean change in glycated haemoglobin (HbA1c) from baseline to month 6 according to renal function subgroup (modified intention‐to‐treat [mITT] population). †Logistic method; P < 0.05 corresponds to significant heterogeneity of treatment effect. B, Percentage of participants achieving HbA1c targets (53 mmol/mol [<7.0%] and 58.5 mmol/mol [<7.5%]) at month 6 (mITT population). CI, confidence interval; eGFR, estimated glomerular filtration rate; Gla‐100, insulin glargine 100 U/mL; Gla‐300, insulin glargine 300 U/mL; LS, least squares; MMRM, mixed model for repeated measurements