Figure 6.

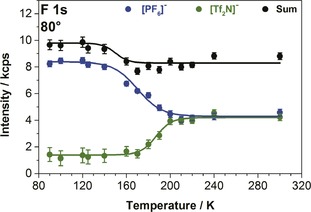
Intensities of the respective F 1s signals of the [PF6]− and [Tf2N]− anions from XPS in 80° emission as a function of the sample temperature upon heating from 90 to 300 K (selected spectra are shown in SI, Figure S6).

Intensities of the respective F 1s signals of the [PF6]− and [Tf2N]− anions from XPS in 80° emission as a function of the sample temperature upon heating from 90 to 300 K (selected spectra are shown in SI, Figure S6).