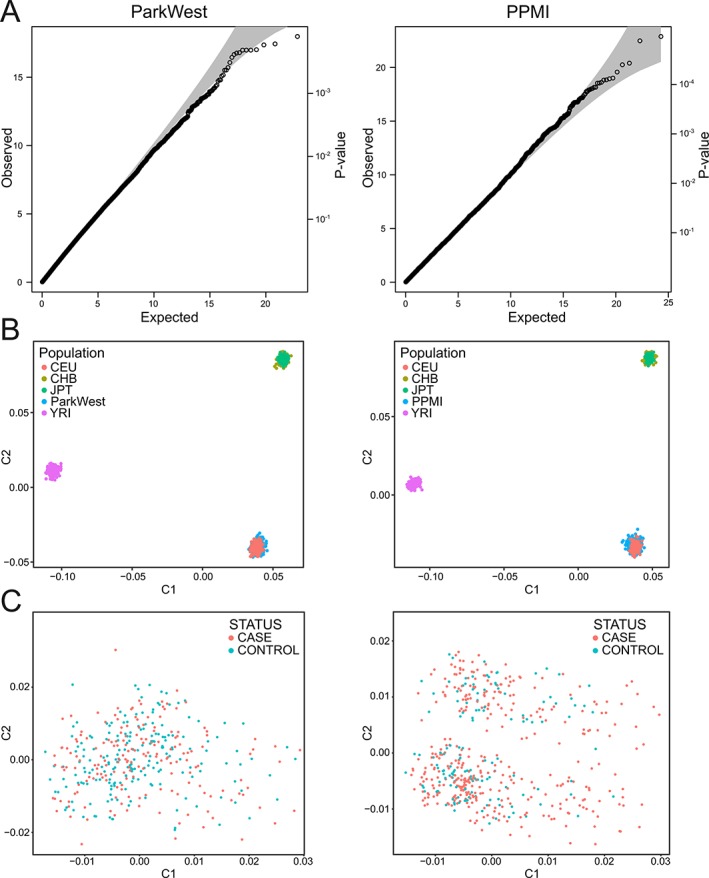
Figure 1.

Quality control. (A) Quantile‐quantile‐plots of association for common variants using chi‐square for Parkinson's Progression Markers Initiative and logistic regression with significant principal components (3 and 6) as covariates for ParkWest. (B) Population stratification (multidimensional scaling) against HapMap populations (CEU, Utah residents with Northern and Western European ancestry; CHB, Han Chinese in Beijing, China; JPT, Japanese in Tokyo, Japan; YRI, Yoruba in Ibadan, Nigeria). (C) Multidimensional scaling plots show no stratification between cases and controls in any of the cohorts. All plots are based on data after quality control. C1, first principal component; C2, second principal component.
