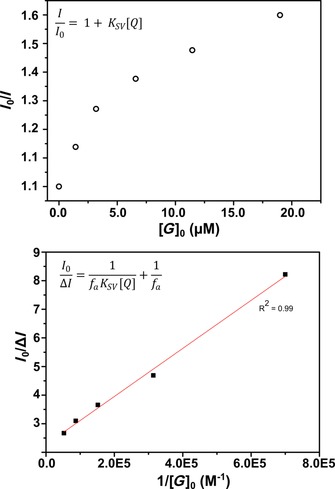
Figure 8.

Stern–Volmer analysis of the fluorescence titration data. Top: Stern–Volmer plot of the fluorescence titration of 0.8 μm Fe4(Zn‐L)6 versus the concentration of added guest/quencher 1. Bottom: Modified Stern–Volmer plot of the fluorescence titration of 0.8 μm Fe4(Zn‐L)6 versus the reciprocal of the concentration of added guest/quencher 1.
