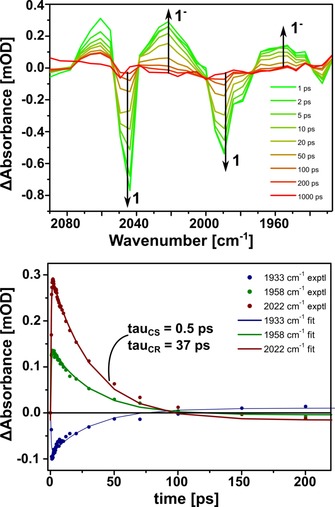
Figure 10.

TRIR spectroscopy of 1⋅Fe4(Zn‐L)6. Top: Spectral evolution during TRIR studies. The increasing band at 2060 cm−1 is due to a hot vibrational state. Bottom: Experimental and fitted rise and decay profiles from TRIR studies at three wavelength maxima. mOD=milli optical density.
