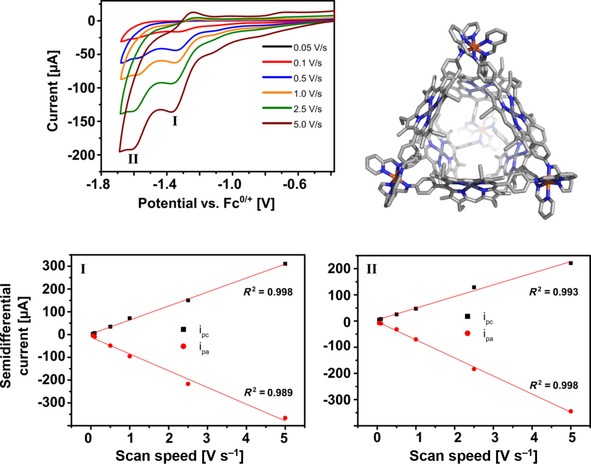
Figure 11.

Cyclic voltammogram of 0.4 mm Fe4(Zn‐L)6 in acetonitrile containing 0.1 m nBu4PF6 as electrolyte. Top: Cyclic voltammogram at various scan speeds showing the first two reduction waves. Bottom left: Plot of the semidifferential peak current of the first reduction wave against the scan speed indicating that the redox event is solution‐based. Bottom right: Plot of the semidifferential peak current of the second reduction wave against the scan speed indicating that the redox event is solution‐based.
