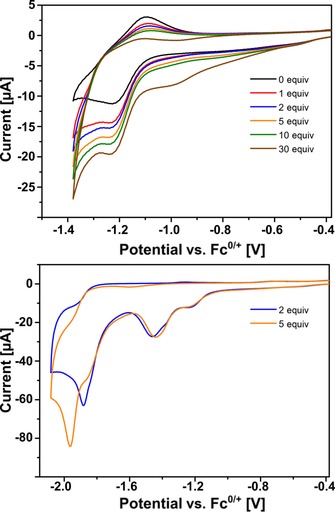
Figure 14.

Cyclic voltammogram of 0.4 mm 1⋅Fe4(Zn‐L)6 and increasing concentrations of HNEt3PF6 at 0.1 V s−1 in acetonitrile containing 0.1 m nBu4PF6. Top: First wave showing the increase in current due to protonation of the reduced catalyst and decreased reversibility of the back‐oxidation wave. Bottom: Second wave around −1.9 V (vs. Fc/Fc+) corresponding to proton reduction catalysis.
