Figure 1.

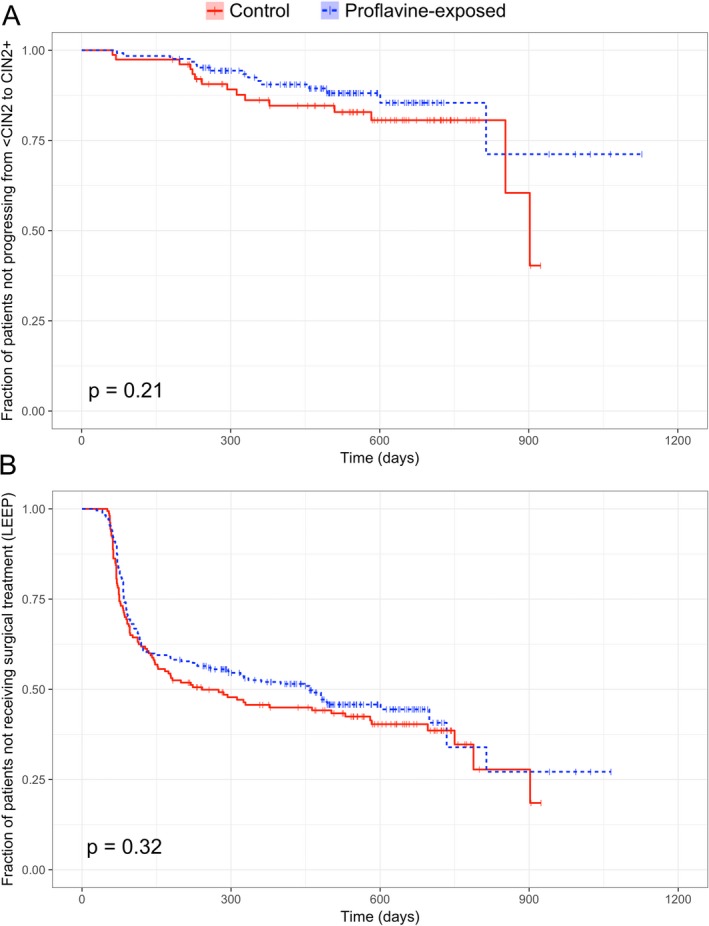
Kaplan–Meier estimate of (a) progression from <CIN2 to CIN2 + and (b) surgical treatment (LEEP). Vertical tick marks represent censoring at the indicated time point. Statistical comparisons were performed using a log‐rank test.

Kaplan–Meier estimate of (a) progression from <CIN2 to CIN2 + and (b) surgical treatment (LEEP). Vertical tick marks represent censoring at the indicated time point. Statistical comparisons were performed using a log‐rank test.