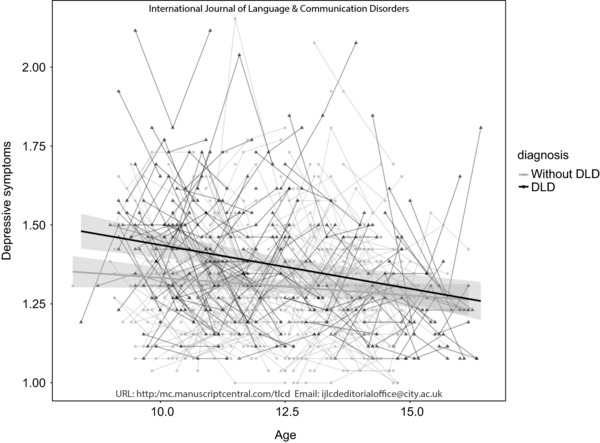
Figure 1.

Depressive symptoms of participants with and without DLD. The measurements of one participant are connected by lines. The regression line represents the predicted value based on the age and diagnosis of the participant with 95% confidence intervals (CI).
