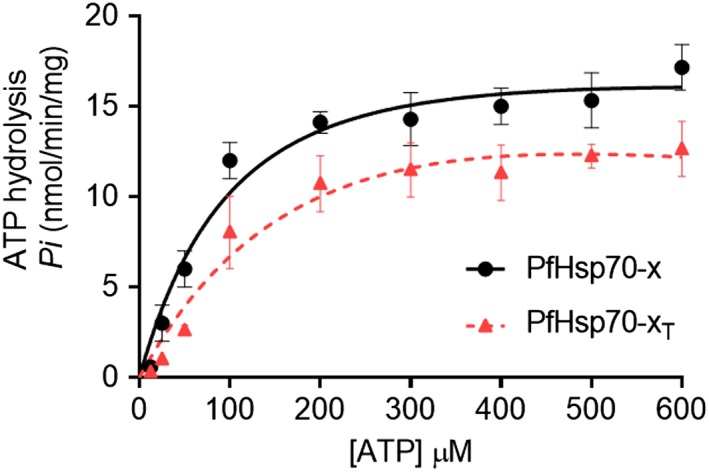
Figure 3.

Analysis of the basal ATPase activity of PfHsp70‐x. The inorganic phosphate released was monitored by direct colourimetry at 595 nm wavelength. The curves represent basal ATPase activities of PfHsp70‐x and PfHsp70‐xT, respectively expressed as mean (±) SD. The assay was carried out in duplicate. At least three assays were conducted using fresh protein batches each time [Color figure can be viewed at http://wileyonlinelibrary.com]
