
Figure 4.
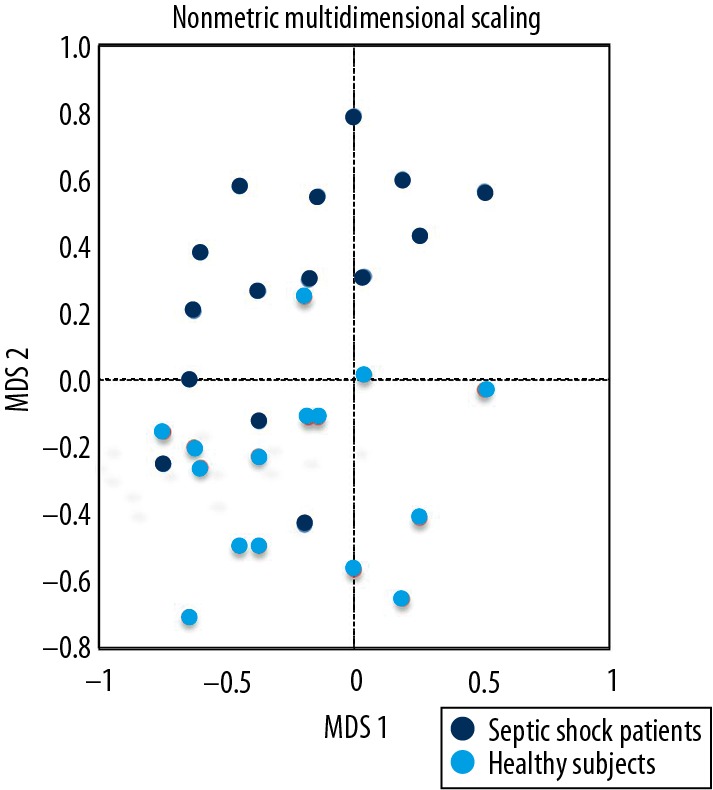
The overall microbial composition of patients with septic shock, showing a definite shift as compared to healthy subjects (nonmetric multidimensional scaling method). Each point represents a sample, with the same color representing the same sample group. The horizontal axis represents the first dimension and the vertical axis represents the second dimension. A shorter distance between dots indicates similar composition of samples.