
Fig. 3.
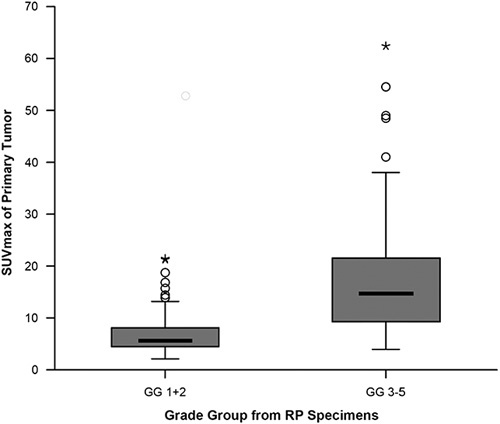
Box plot display of SUVmax values of patients with low-risk (grade group 1 and 2) and high-risk (grade groups 3, 4 and 5) prostate cancer according to pathology reports after radical prostatectomy (P<0.001). GG, grade group.
Official websites use .gov
A
.gov website belongs to an official
government organization in the United States.
Secure .gov websites use HTTPS
A lock (
) or https:// means you've safely
connected to the .gov website. Share sensitive
information only on official, secure websites.
Box plot display of SUVmax values of patients with low-risk (grade group 1 and 2) and high-risk (grade groups 3, 4 and 5) prostate cancer according to pathology reports after radical prostatectomy (P<0.001). GG, grade group.