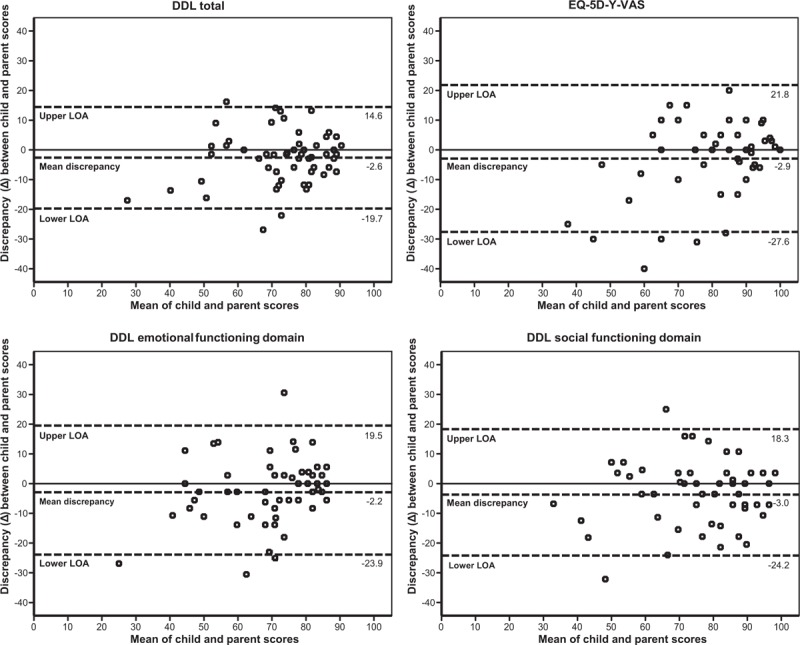
FIGURE 1.

Bland-Altman plots. Top left: DDL total score, top right: EQ-5D-Y-VAS score, bottom left: DDL emotional functioning domain score, bottom right: DDL social functioning domain score. Discrepancy scores (Δ) were calculated by subtracting each parent's score from their child's score. DDL = Defecation Disorder List; EQ-5D-Y-VAS = Euroqol-5-Dimensions-Youth Visual Analogue Scale; LOA = Limits of Agreement.
