
FIGURE 3.
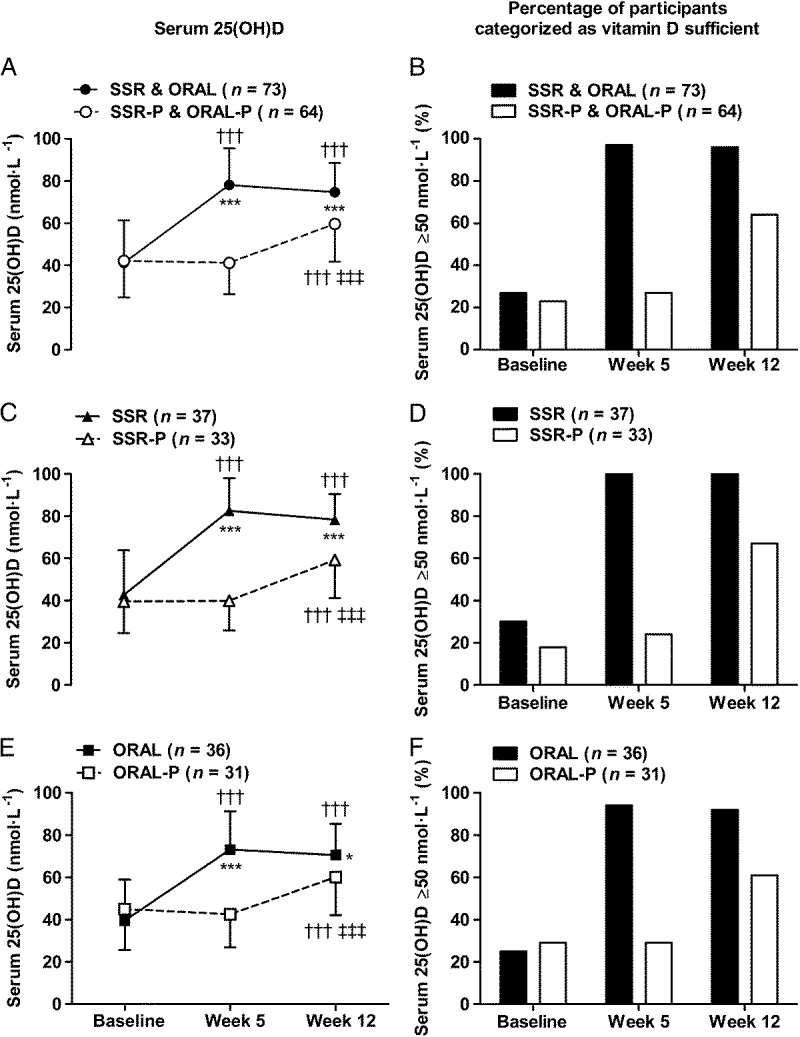
Serum 25(OH)D and percentage of participants categorized as vitamin D sufficient (serum 25(OH)D ≥ 50 nmol·L−1) in response to 12 wk of vitamin D supplementation by SSR and oral vitamin D3 (ORAL). Panels A and B show combined active interventions (SSR and ORAL) vs combined placebo (SSR-P and ORAL-P), panels C and D show SSR vs SSR-P, and panels E & F show ORAL vs ORAL-P. †††P < 0.001, greater than baseline. ‡‡‡P < 0.001, greater than week 5. *P < 0.05 and ***P < 0.001, greater than placebo. Data in panels A, C, and E are mean ± SD.