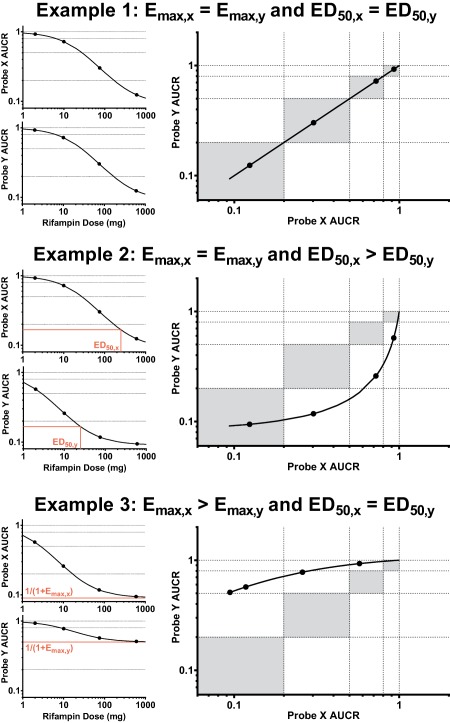
Figure 3.

Example rifampin dose vs. probe drug mean AUCR curves and resulting probe clearance induction relationship curve with interpretation. Gray areas represent induction magnitude parity between probes, i.e., similar weak/weak, moderate/moderate, and strong/strong induction of probes X and Y.
